Reading time: 12 minutes and 45 seconds.
Create a bar chart using Google Charts
We will be using the Spotfire API and Google Charts to create a basic bar chart.
This tutorial will cover the following:
- Initial setup
- Consuming and visualizing data
- Selection/marking
- Theme-ing
- Controlling the mod using a popout
- Export to PDF
The mod created in this tutorial ('js-dev-barchart-googlecharts'), as well as the starter project used in the tutorial ('ts-dev-starter'), can be found among the example projects. The example project covers some additional cases that are outside the scope of this tutorial.
Dataset
The dataset used in this tutorial can be found here. It is a reduced version of this dataset.
Prerequisites
All prerequisites are listed in the general getting started guide.
1. Initial setup
- Create a visualization mod using the SDK, follow the initial instructions and then open the project in Visual Studio Code.
- In Visual Studio Code start the local development server.
- In Spotfire, load the dataset to create a new analysis file.
- Go to Tools > Development > Mods development and click the button Connect to development server. Make sure that the default server is the same in Spotfire and Visual Studio code (http://127.0.0.1:8090).
- You should see some mod metadata on the screen, which means the mod is working.
- Click Add to page to add a first instance of your new visualization mod.
2. Add Google Charts library
- We will be using this Google example.
- Add the Google Chart loader script to
index.html(before thebuild/main.jssscript).
     <body>
         <div id="mod-container"></div>
         <script id="spotfire-loader">var Spotfire=function(e){"use strict";return e.initialize=function(e){var t="sfTemp"+1e4*Math.random()+"Cb",a=window;a[t]=e;var r={subject:"GetUrl",callbackId:-1,...</script>
+        <script type="text/javascript" src="https://www.gstatic.com/charts/loader.js"></script>
         <script src="build/main.js"></script>
     </body>
 </html>
- Add type definitions from google.visualization by installing the corresponding npm package:
npm install --save @types/google.visualization
- Update the style in the
main.cssfile.
-body{
-    margin: 0;
-    overflow: hidden;
-}

-#mod-container {
-    white-space: pre;
-}

+html, body, #mod-container {
+    margin: 0;
+    height: 100%;
+    overflow: hidden;
+}
- Add the gstatic domain name as an external resource in the
mod-manifest.json. External resources from unknown domains will be blocked from loading for security reasons.
    "files": [
        "index.html",
        "main.css",
        "main.js"
-    ]
+    ],
+    "externalResources": ["https://www.gstatic.com/"]
- Paste the example code below into
main.tsinside therenderfunction
     async function render(dataView: Spotfire.DataView, windowSize: Spotfire.Size, prop: Spotfire.ModProperty<string>) {

        /**
         * Check the data view for errors
         */
        let errors = await dataView.getErrors();
        if (errors.length > 0) {
            // Showing an error overlay will hide the mod iframe.
            // Clear the mod content here to avoid flickering effect of
            // an old configuration when next valid data view is received.
            mod.controls.errorOverlay.show(errors);
            return;
        }
        mod.controls.errorOverlay.hide();

        /**
         * Get the hierarchy of the categorical X-axis.
         */
        const xHierarchy = await dataView.hierarchy("X");
        const xRoot = await xHierarchy.root();

        if (xRoot == null) {
            // User interaction caused the data view to expire.
            // Don't clear the mod content here to avoid flickering.
            return;
        }

-        /**
-         * Print out to document
-         */
-        const container = document.querySelector("#mod-container");
-        container.textContent = `windowSize: ${windowSize.width}x${windowSize.height}\r\n`;
-        container.textContent += `should render: ${rows.length} rows\r\n`;
-        container.textContent += `${prop.name}: ${prop.value()}`;
-
-        /**
-         * Signal that the mod is ready for export.
-         */
-        context.signalRenderComplete();

+        google.charts.load("current", { packages: ["corechart"] });
+        google.charts.setOnLoadCallback(drawChart);
+        function drawChart() {
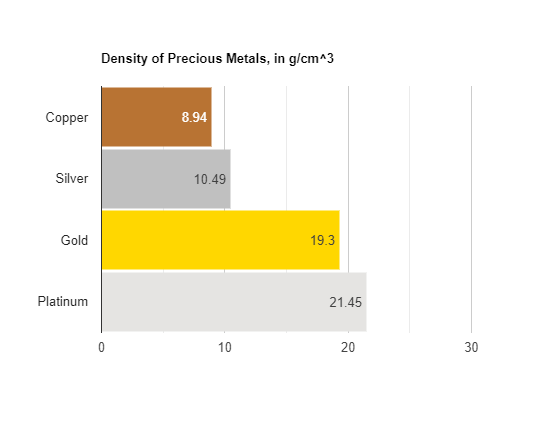
+            var data = google.visualization.arrayToDataTable([
+                ["Element", "Density", { role: "style" }],
+                ["Copper", 8.94, "#b87333"],
+                ["Silver", 10.49, "silver"],
+                ["Gold", 19.3, "gold"],
+                ["Platinum", 21.45, "color: #e5e4e2"]
+            ]);
+
+            var view = new google.visualization.DataView(data);
+            view.setColumns([0, 1, { calc: "stringify", sourceColumn: 1, type: "string", role: "annotation" }, 2]);
+
+            var options = {
+                title: "Density of Precious Metals, in g/cm^3",
+                width: 600,
+                height: 400,
+                bar: { groupWidth: "95%" },
+                legend: { position: "none" },
+            };
+            var chart = new google.visualization.BarChart(document.getElementById("barchart_values"));
+            chart.draw(view, options);
+        }
     }
 });
- Update the bar chart container ID (in
index.html, our container ID is"mod-container"). Also note that there is a warning from TypeScript that the argument to theBarChartmay be null. Since we are in full control of the html code, it is safe to assert thatgetElementByIdwill not return null. This is done by adding an exclamation mark (!) after the argument.
            var options = {
               title: "Density of Precious Metals, in g/cm^3",
               width: 600,
               height: 400,
               bar: { groupWidth: "95%" },
               legend: { position: "none" },
           };
-            var chart = new google.visualization.BarChart(document.getElementById("barchart_values"));
+            var chart = new google.visualization.BarChart(document.getElementById("mod-container")!);
            chart.draw(view, options);
Also note that there is a warning about the option type. This is because the type is here deduced from usage, not from declaration. This is easily fixed by specifying the correct type for the options variable.
-            var options = {
+            var options: google.visualization.BarChartOptions = {
               title: "Density of Precious Metals, in g/cm^3",
               width: 600,
               height: 400,
               bar: { groupWidth: "95%" },
               legend: { position: "none" },
           };
- Save the changes. You should see the example working in Spotfire and there should be no warnings in the code editor.
- Use
async/awaitto get rid of extra code. - Make the chart fit the screen by providing a chart area with some predefined margins.
- Get rid of the chart title.
-       google.charts.load("current", { packages: ["corechart"] });
-       google.charts.setOnLoadCallback(drawChart);

-       async function drawChart() {
+       await google.charts.load("current", { packages: ["corechart"] });
          var data = google.visualization.arrayToDataTable([
              ["Element", "Density", { role: "style" }],
              ["Copper", 8.94, "#b87333"],
              ["Silver", 10.49, "silver"],
              ["Gold", 19.3, "gold"],
              ["Platinum", 21.45, "color: #e5e4e2"]
          ]);

          var view = new google.visualization.DataView(data);
          view.setColumns([0, 1, { calc: "stringify", sourceColumn: 1, type: "string", role: "annotation" }, 2]);

          var options: google.visualization.BarChartOptions = {
-             title: "Density of Precious Metals, in g/cm^3",
-             width: 600,
-             height: 400,
              bar: { groupWidth: "95%" },
              legend: { position: "none" },
+             chartArea: { left: 85, top: 20, right: 10, bottom: 40 }
          };
          var chart = new google.visualization.BarChart(document.getElementById("mod-container"));
          chart.draw(view, options);
        }
-     }
3. Consume Spotfire data
- The
mod-manifest.jsonfile declares three axes; a categorical X-axis, a continuous Y-axis, and a dual mode color axis. While it is perfectly valid for a bar chart, we’ll make this tutorial slightly simpliflied by changing the color axis to categorical. Note that changing themod-manifest.jsonrequires an explicit reload in the Mods development tool.
    "dataViewDefinition": {
        "colorAxis": {
-            "mode": "dual",
+            "mode": "categorical",
            "dropTarget": {
                "icon": "Color",
                "description": "Color by {0}"
            }
        },
- We create hierarchies for X and Color dimensions. These are defined in the manifest and should not be confused with actual color values (css-color from now on to avoid confusion).
- We then use this grouped data to extract column names, values, and css-colors.
- A Google visualization expects data to be in the following format (and complains if it’s not):
| SeriesNames | Series1 | Style | Series2 | Style | Series3 | Style |
|---|---|---|---|---|---|---|
| Category1 | Value11 | CssColor11 | Value12 | CssColor12 | Value13 | CssColor13 |
| Category2 | Value21 | CssColor21 | Value22 | CssColor22 | Value23 | CssColor23 |
- We loop over the X hierarchy to create the data table by filling a row with null values first, and then populating it with existing values at proper positions.
-    function drawChart() {
-        var data = google.visualization.arrayToDataTable([
-            ["Element", "Density", { role: "style" }],
-            ["Copper", 8.94, "#b87333"],
-            ["Silver", 10.49, "silver"],
-            ["Gold", 19.3, "gold"],
-            ["Platinum", 21.45, "color: #e5e4e2"]
-        ]);

-        var view = new google.visualization.DataView(data);
-        view.setColumns([0, 1, { calc: "stringify", sourceColumn: 1, type: "string", role: "annotation" }, 2]);

+    async function drawChart() {
+        const colorHierarchy = (await dataView.hierarchy("Color"))!;
+        const colorLeafNodes = (await colorHierarchy.root())!.leaves();
+        const colorDomain = colorHierarchy.isEmpty ? ["All Values"] : colorLeafNodes.map((node) => node.formattedPath());

+        const xLeafNodes = (await xHierarchy.root())!.leaves();

+        const dataColumns : any[] = ["Columns"];
+        colorDomain.forEach(value => dataColumns.push(value, { role: "style" }));
+
+        const dataRows : any[][] = [];
+        xLeafNodes.forEach(
+            (node) => {
+               let valueAndColorPairs = new Array(colorLeafNodes.length).fill([0, ""]).flat()
+               node.rows().forEach((r) => {
+                   let colorIndex = !colorHierarchy.isEmpty ? r.categorical("Color").leafIndex : 0;
+                   let yValue = r.continuous("Y").value();
+                   valueAndColorPairs[colorIndex * 2] = yValue;
+                   valueAndColorPairs[colorIndex * 2 + 1] = r.color().hexCode;
+               });
+               const dataRow = [node.formattedPath(), valueAndColorPairs].flat();
+               dataRows.push(dataRow)
+            }
+        );
+
+        var data = google.visualization.arrayToDataTable([dataColumns, ...dataRows]);

         var options = {
             bar: { groupWidth: "95%" },
             legend: { position: "none" },
             chartArea: { left: 85, top: 20, right: 10, bottom: 40 }
         };
         var chart = new google.visualization.BarChart(document.getElementById("mod-container"));
-        chart.draw(view, options);
+        chart.draw(data, options);
- Notice the
possibly nullwarning regarding the usage of xHierarchy. This is a false negative due to the use of the asynchronoussetOnLoadCallback, and we will handle this issue later in this tutorial. - Not all combinations of X and Color domains will be renderable by Google Charts out of the box, without special treatment. We will guard against this with a
try/catchblock. - The full code of the
js-dev-barchart-googlechartsexample project goes a little bit more in depth than this tutorial and covers some additional cases.
-        var data = google.visualization.arrayToDataTable([dataColumns, ...dataRows]);
+        let data : google.visualization.DataTable;
+        try {
+            data = google.visualization.arrayToDataTable([dataColumns, ...dataRows]);
+        } catch (e: any) {
+            mod.controls.errorOverlay.show(e);
+            return;
+        }
4. Selection/marking
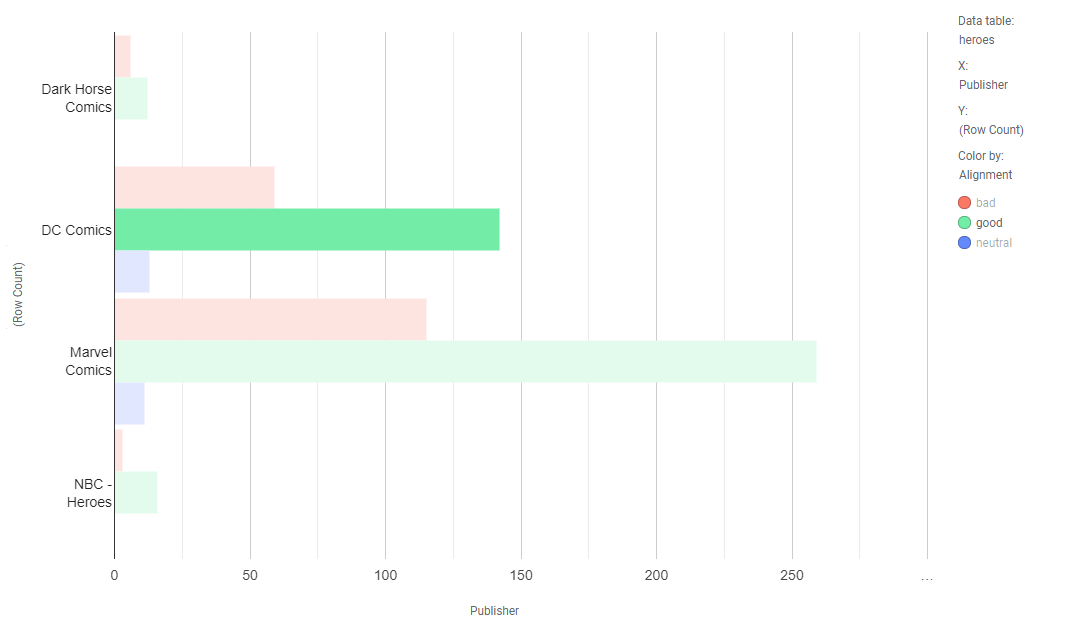
- Add selection/marking logic. We listen for the
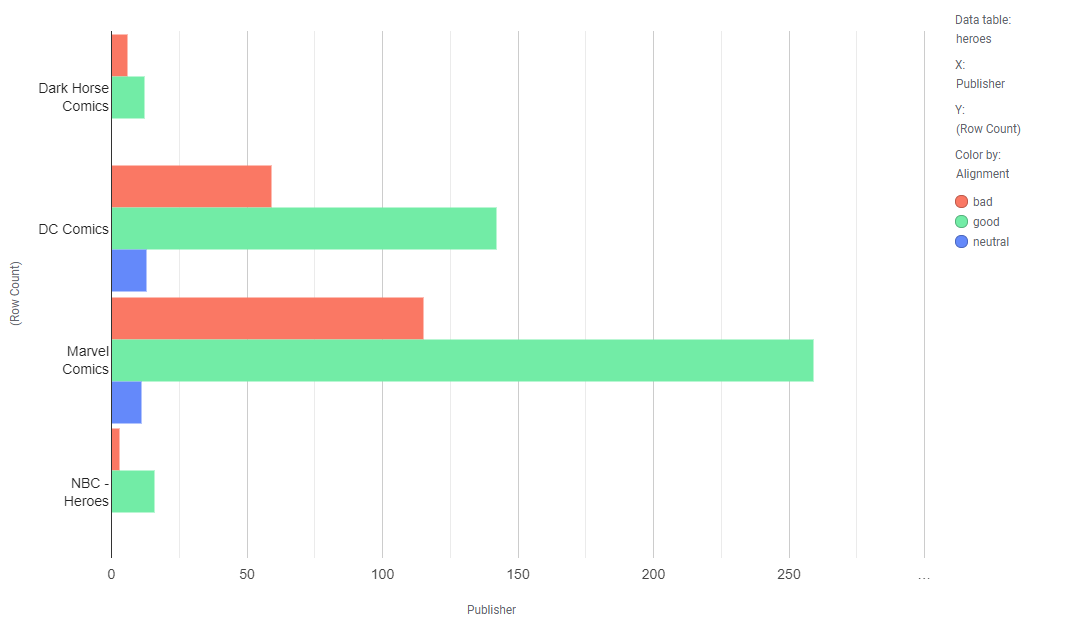
"select"event and extract X and Color values (not css-color!) by index in their respective domains. The Color index is halved because we have 2 times as many columns due to styling being applied (see table above). - The rows (in this case there will be only one row) to mark will be in the intersection of the set of rows for the marked color and the set of rows for the marked X value. An obvious optimization would be to store the rows as a hash map to eliminate redundancy.
         var chart = new google.visualization.BarChart(document.getElementById("mod-container"));
         chart.draw(data, options);

+        google.visualization.events.addListener(chart, "select", () => {
+            const selection = chart.getSelection()[0];
+
+            if (!selection) return;
+            const { row, column } = selection;
+            if (column == null || row == null) {
+                return;
+            }
+            const xIndex = row;
+            const colorIndex = (column - 1) / 2;
+
+            intersection(xLeafNodes[xIndex].rows(), colorLeafNodes[colorIndex].rows()).forEach((r) => r.mark());
+       });
+
+        function intersection(rows1: Spotfire.DataViewRow[], rows2: Spotfire.DataViewRow[]) {
+            return rows1.filter((r) => rows2.indexOf(r) > -1);
+        }
     }
- To clear the marking on background click, as native Spotfire visualizations do, we listen for the
"click"event and check its target ID. Unfortunately, the Google API is untyped regarding events, hence theanytype.
        function intersection(rows1, rows2) {
            return rows1.filter((r) => rows2.indexOf(r) > -1);
+
+        google.visualization.events.addListener(chart, "click", (e: any) => {
+            if (e.targetID == "chartarea") {
+                dataView.clearMarking();
+                return;
+            }
+        });
     }
 });
5. Controlling the mod using a popout
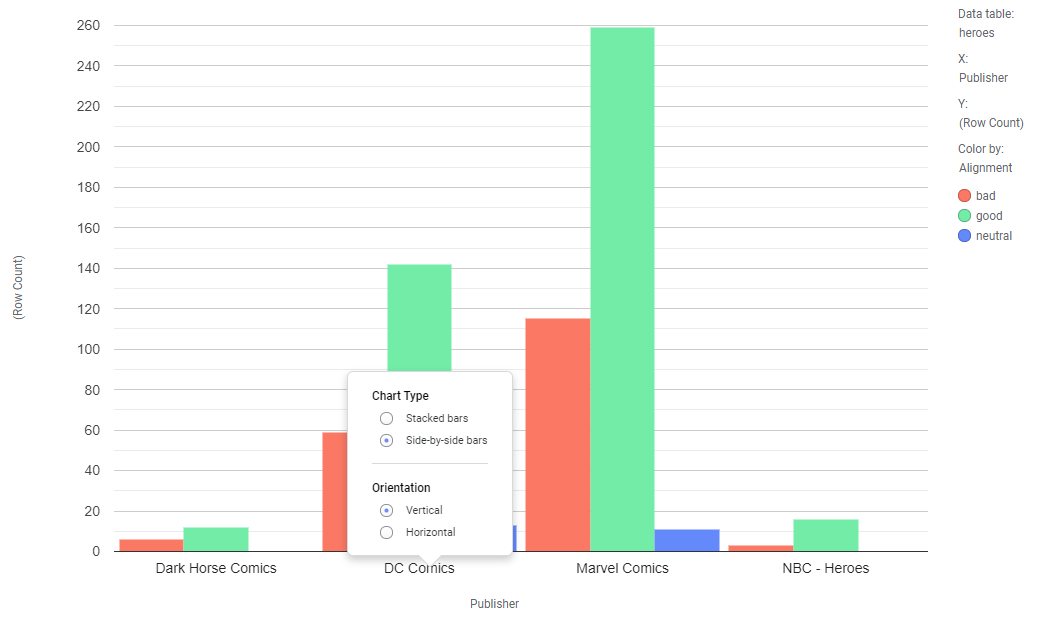
- We would like to control the chart’s orientation (
horizontal/vertical) and stacking (side-by-side/stacked). The Mods API allows us to do this via a popout menu. - First, we add them as properties to the manifest.
     "icon": "icon.svg",
     "properties": [
         {
-            "name": "myProperty",
+            "name": "orientation",
             "type": "string",
-            "defaultValue": "myValue"
+            "defaultValue": "vertical"
+        },
+        {
+            "name": "stacking",
+            "type": "string",
+            "defaultValue": "side-by-side"
         }
     ],
-
Then we add the new properties to the
readloop and pass them down to therenderfunction. -
Since the
mod-manifest.jsonfile has changed, we will need to reload the manifest.
    /**
     * Create the read function.
     */
-    const reader = mod.createReader(mod.visualization.data(), mod.windowSize(), mod.property("myProperty"));
+    const reader = mod.createReader(
+        mod.visualization.data(),
+        mod.windowSize(),
+        mod.property("orientation"),
+        mod.property("stacking")
+    );

    /**
     * Initiate the read loop
     */
    reader.subscribe(render);

     /**
      * @param {Spotfire.DataView} dataView
      * @param {Spotfire.Size} windowSize
-     * @param {Spotfire.ModProperty<string>} prop
+     * @param {Spotfire.ModProperty<string>} orientation
+     * @param {Spotfire.ModProperty<string>} stacking
      */
-    async function render(dataView, windowSize, prop) {
+    async function render(dataView, windowSize, orientation, stacking) {
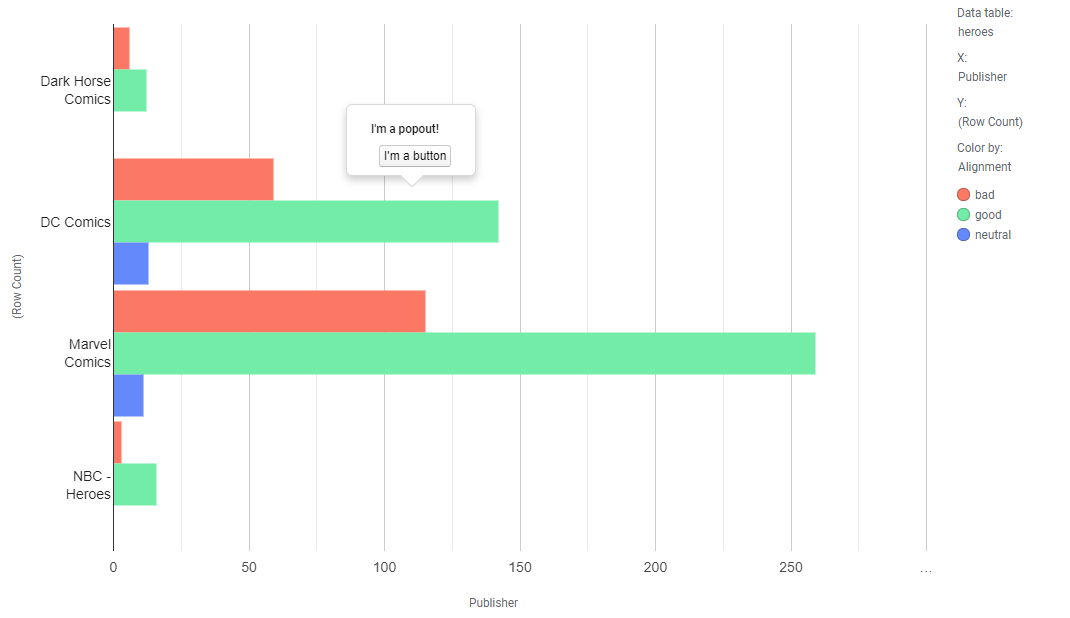
- Update the background click callback to show a test popout.
         google.visualization.events.addListener(chart, "click", ({ targetID, x, y }) => {
             if (targetID == "chartarea") {
                 dataView.clearMarking();
+                showPopout({ x, y });
                 return;
             }
         });

+        const { popout } = mod.controls;
+        function showPopout(e) {
+            popout.show(
+                {
+                    x: e.x,
+                    y: e.y,
+                    autoClose: true,
+                    alignment: "Bottom",
+                    onChange: popoutChangeHandler
+                },
+                popoutContent
+            );
+        }
+
+        const { section } = popout;
+        const { button } = popout.components;
+        const popoutContent = () => [
+           section({ heading: "I'm a popout!", children: [button({ text: "I'm a button", name: "button" })] })
+        ];
+
+        function popoutChangeHandler() {}
     }
 });
- Add a tiny helper function to check property value.
- On each render we check the stacking and orientation properties and update the chart configuration accordingly. Stacking is a simple boolean, but orientation requires different classes for
horizontalandverticaltypes of charts.
+        const is = property => value => property.value() == value;
+
         var options = {
             bar: { groupWidth: "95%" },
             legend: { position: "none" },
-            chartArea: { left: 85, top: 20, right: 10, bottom: 40 }
+            chartArea: { left: 85, top: 20, right: 10, bottom: 40 },
+            isStacked: is(stacking)("stacked")
         };

-        var chart = new google.visualization.BarChart(document.getElementById("mod-container"));
+
+        const container = document.querySelector("#mod-container");
+        let chart;
+        if (is(orientation)("horizontal")) {
+            chart = new google.visualization.BarChart(container);
+        } else {
+            chart = new google.visualization.ColumnChart(container);
+        }
+
         chart.draw(data, options);
- To mimic native Spotfire bar chart behavior, we show a popout on X-axis click (Y-axis for horizontal orientation).
         google.visualization.events.addListener(chart, "click", ({ targetID, x, y }) => {
             if (targetID == "chartarea") {
                 dataView.clearMarking();
-                showPopout({ x, y });
                 return;
             }
+
+            if (is(orientation)("vertical") && targetID.indexOf("hAxis") != -1) {
+                showPopout({ x, y });
+                return;
+            }
+
+            if (is(orientation)("horizontal") && targetID.indexOf("vAxis") != -1) {
+                showPopout({ x, y });
+                return;
+            }
         });
- Create popout content from the available components.
- Listen for popout changes and update property values. This will trigger a re-render and add a step to the native Undo stack.
         const { section } = popout;
-        const { button } = popout.components;
-        const popoutContent = () => [
-           section({ heading: "I'm a popout!", children: [button({ text: "I'm a button", name: "button" })] })
-        ];

+        const { radioButton } = popout.components;
+        const popoutContent = () => [
+            section({
+                heading: "Chart Type",
+                children: [
+                    radioButton({
+                        name: stacking.name,
+                        text: "Stacked bars",
+                        value: "stacked",
+                        checked: is(stacking)("stacked")
+                    }),
+                    radioButton({
+                        name: stacking.name,
+                        text: "Side-by-side bars",
+                        value: "side-by-side",
+                        checked: is(stacking)("side-by-side")
+                    })
+                ]
+            }),
+            section({
+                heading: "Orientation",
+                children: [
+                    radioButton({
+                        name: orientation.name,
+                        text: "Vertical",
+                        value: "vertical",
+                        checked: is(orientation)("vertical")
+                    }),
+                    radioButton({
+                        name: orientation.name,
+                        text: "Horizontal",
+                        value: "horizontal",
+                        checked: is(orientation)("horizontal")
+                    })
+                ]
+            })
+        ];


-        function popoutChangeHandler() {}
+        function popoutChangeHandler({ name, value }) {
+            name == orientation.name && orientation.set(value);
+            name == stacking.name && stacking.set(value);
+        }
- Lastly, add a pointer cursor to
svg textrule inmain.cssto signal an interactive element.
html, body, #mod-container {
     margin: 0;
     height: 100%;
     overflow: hidden;
}
+
+svg text {
+    cursor: pointer;
+}
6. Use Spotfire theme and styling
- Extract style info from
context. - Update the
optionsobject.
+        const context = mod.getRenderContext();
+        const styling = context.styling;
+        const textStyle = {
+            fontSize: styling.scales.font.fontSize,
+            fontName: styling.scales.font.fontFamily,
+            color: styling.scales.font.color
+        };
+
+        const baselineColor = styling.scales.line.stroke;
+        const gridlines = { color: "transparent" };

-        var options = {
-            bar: { groupWidth: "95%" },
+        const options = {
+            bar: { groupWidth: "80%" },
+            backgroundColor: { fill: "transparent" },
             legend: { position: "none" },
             chartArea: { left: 85, top: 20, right: 10, bottom: 40 },
-            isStacked: is(stacking)("stacked")
+            isStacked: is(stacking)("stacked"),
+            hAxis: {
+                textStyle,
+                baselineColor,
+                gridlines
+            },
+            vAxis: {
+                textStyle,
+                baselineColor,
+                gridlines,
+                minValue: 0
+            }
         };
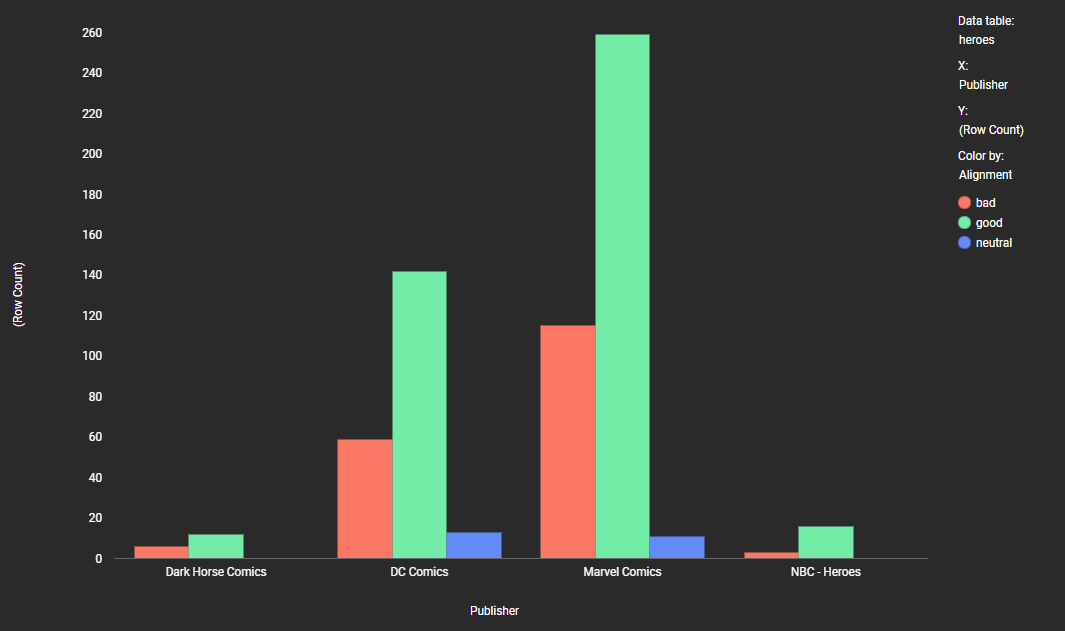
- In Spotfire, change canvas styling to Dark (Visualizations > Canvas styling > Dark). You should see the colors change according to the theme.
7. Prepare for export
- For export to work, we need to let Spotfire know when rendering is complete.
        function popoutChangeHandler({ name, value }) {
            name == orientation.name && orientation.set(value);
            name == stacking.name && stacking.set(value);
        }

+       google.visualization.events.addListener(chart, "ready", () => context.signalRenderComplete());
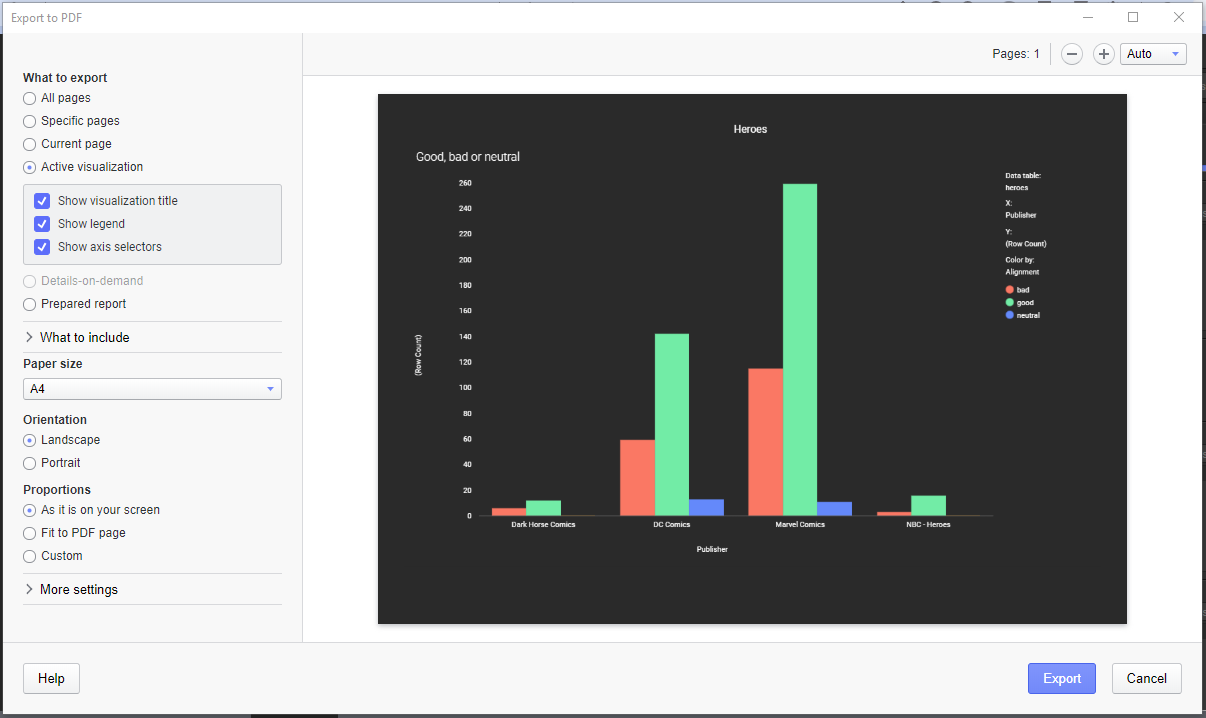
- Go to File > Export > Visualization to PDF to test the export feature.
- Note that this example mod is using external resources, hence it will not be possible to export using the web client, see the manifest schema documentation.

